Multifit /
PlottingAutomatedFitResults
Mapplot plots of automatic fit results
The menu item Compare results with active datasets: mapplot allows you to plot both the active dataset and fit results. Options in the dialog include
- range of intensities,
- range of 2 theta,
Load the fit data and choose either
- plot data,
- plot fit,
- plot both,
- and others.
Paying around with parameters, you should quickly get something like this
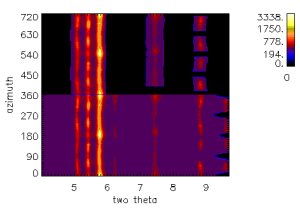
Display the original data and the fit results. Azimuth angles of the fit results are shifted.
2-D plots of automatic fit results
For a more precise comparison of data and fit results, select the Compare results with active datasets: 2-D plots. You'll have a dialog to choose the fit results and a dialog with options to choose
- azimuth values for which to plot the diffractograms
- a stretch factor (larger values will bring the plots together)
- how often to label azimuth angles
- the 2 theta range.
If you choose Plot, the experimental data will be plotted in black and the fit in blue, as in the figure below
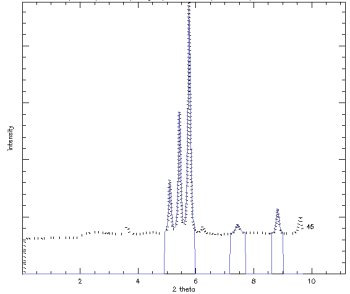
Display the original data and the fit results as diffractograms.
If you choose Dynamic plot you will see a movie of the experimental data and fit cycling through the azimuth angles you chose to plot.